PERFORMANCE ANALYTICS

Binary Options Analytics for Evidence-Based Review

Analytics in binary options trading is not about finding a better entry. It is about understanding where your execution is consistent, where it breaks down, and what behavioral patterns are driving the difference.

TradeReality provides calendar, session, asset, direction, payout, and breakeven analytics — built from your own manually entered trade data. No broker connection. No external signals.

Evidence-based review means looking at what your trades actually show, not what you remember or hope. That is the purpose of analytics.

TradeReality binary edge analytics showing win rate, breakeven, asset and direction breakdown

What binary options analytics means

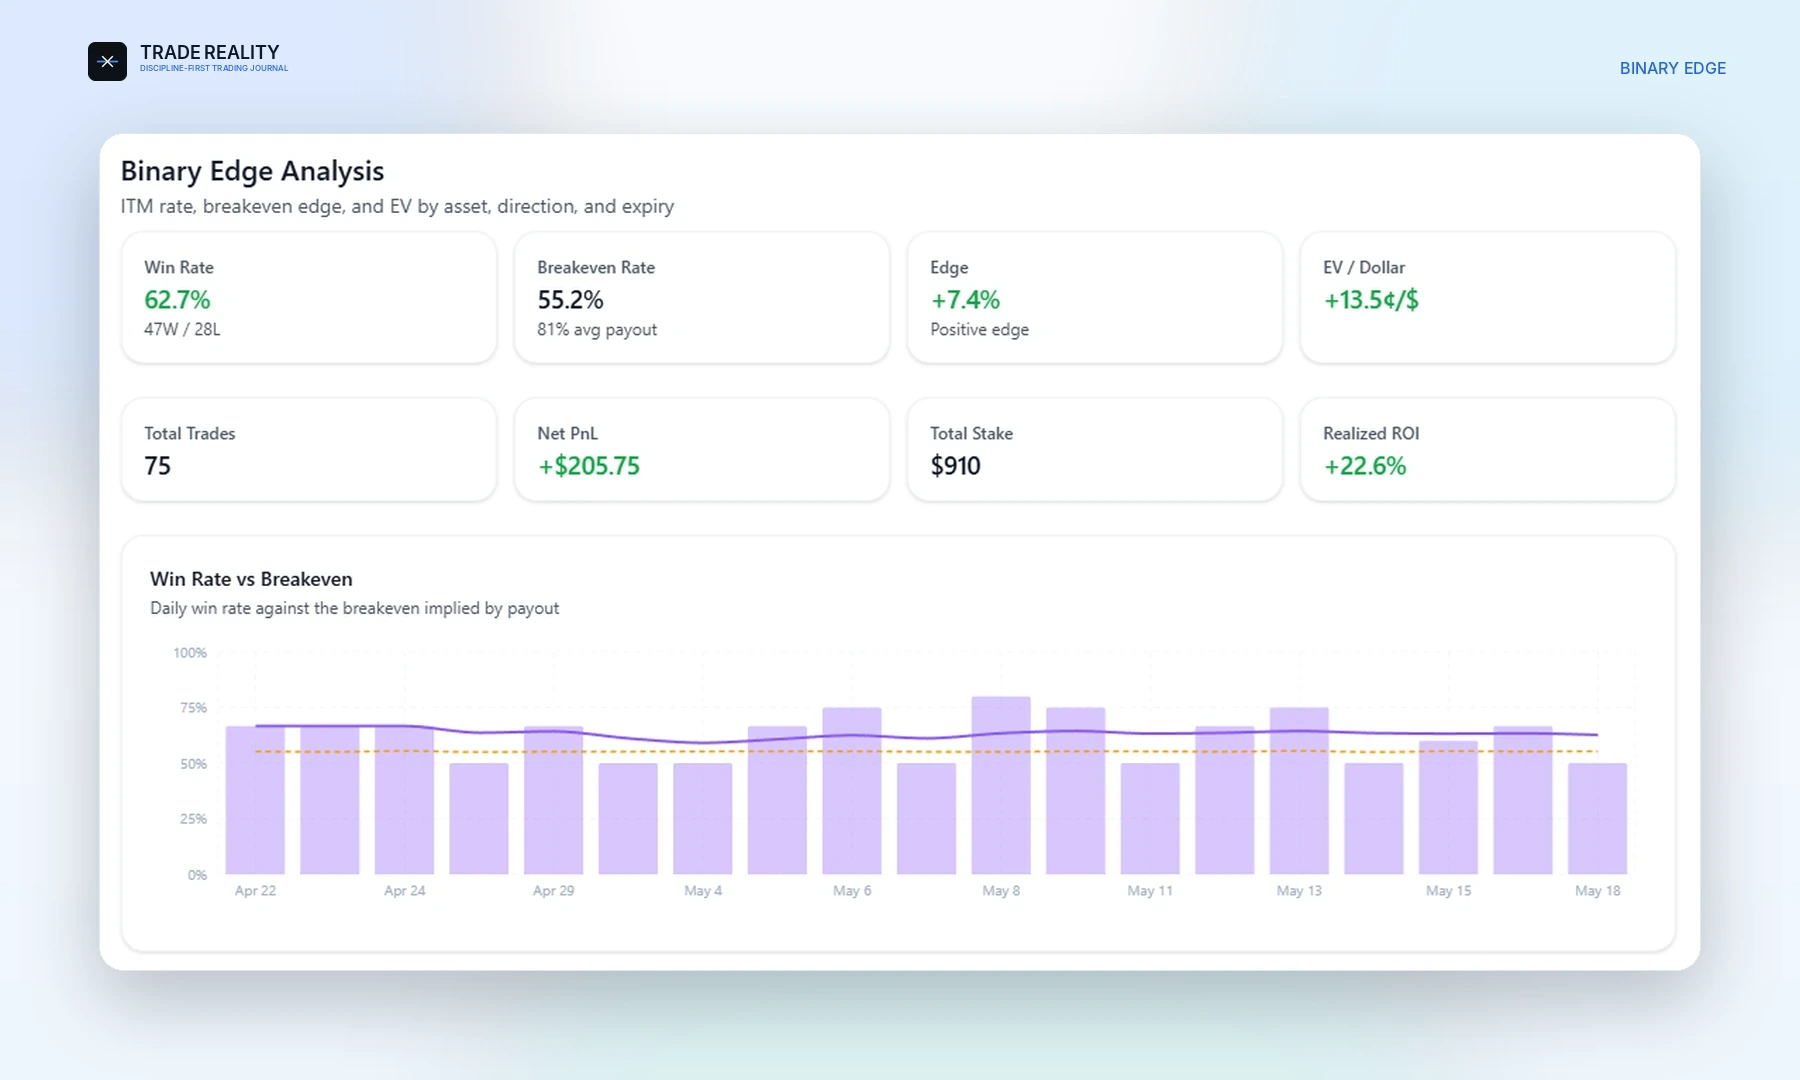
Analytics in binary options starts with two questions: what is your win rate, and what does it need to be to cover your losses? Everything else builds from there.

Once you know your breakeven win rate (a function of payout structure), you can evaluate whether each asset, session window, or direction cluster meets or misses that threshold. The ones that consistently miss are candidates for correction — or removal from your setup criteria.

Win rate vs. breakeven

The gap between your actual win rate and your payout-adjusted breakeven threshold.

Asset and direction split

Which assets and directions perform above or below your breakeven across the same period.

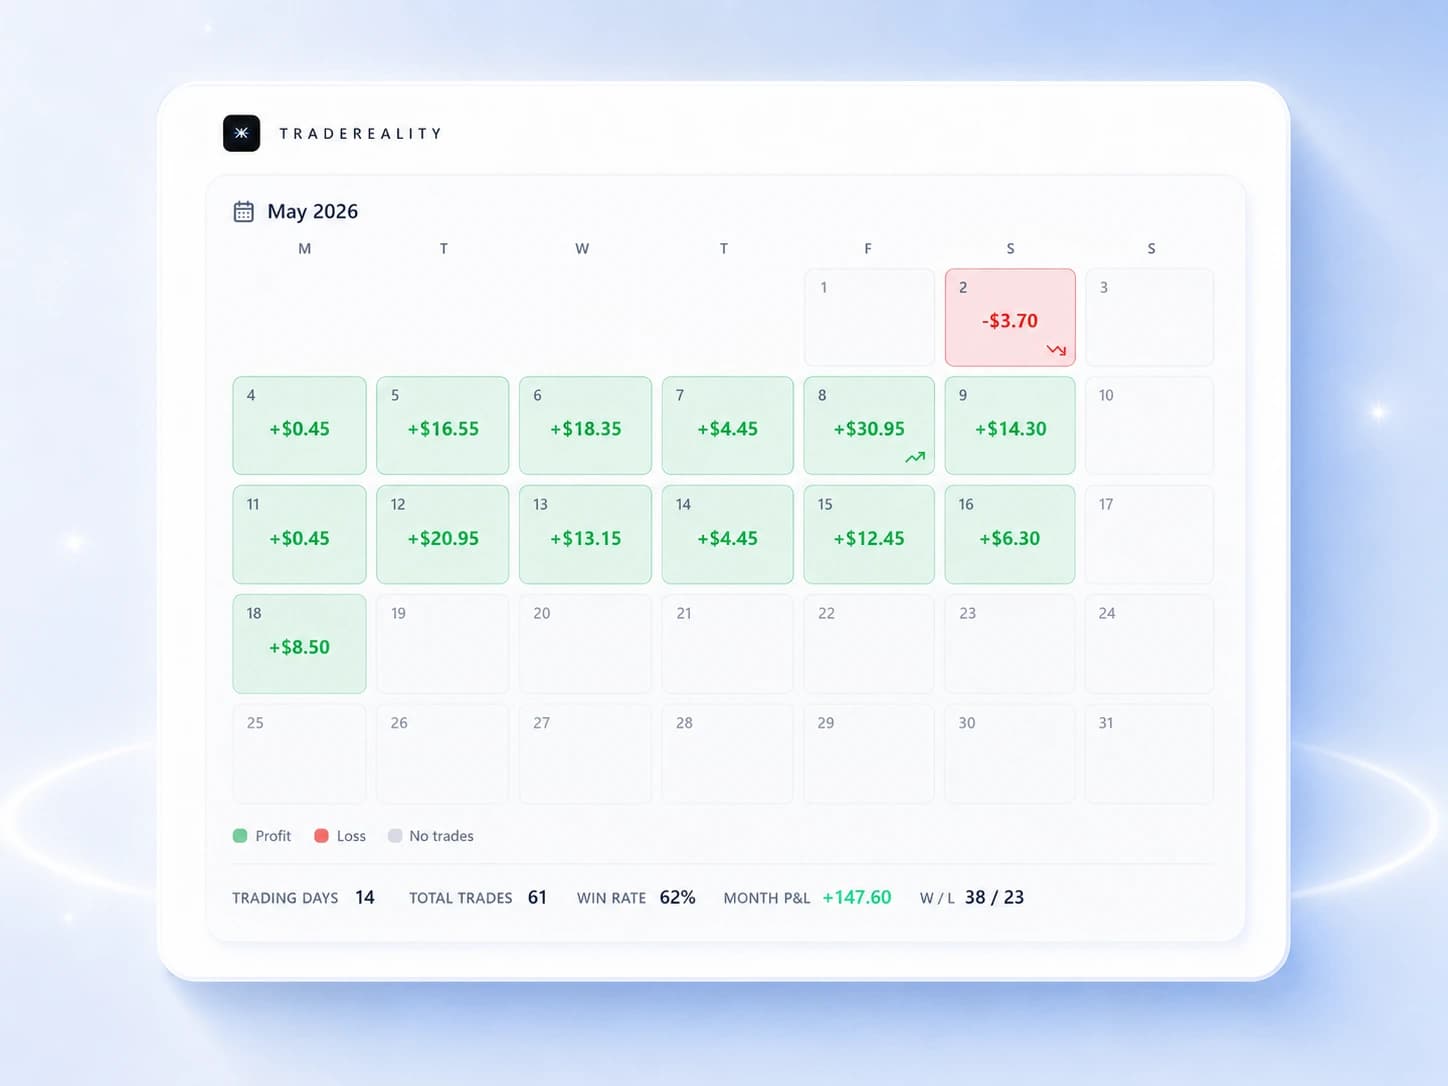
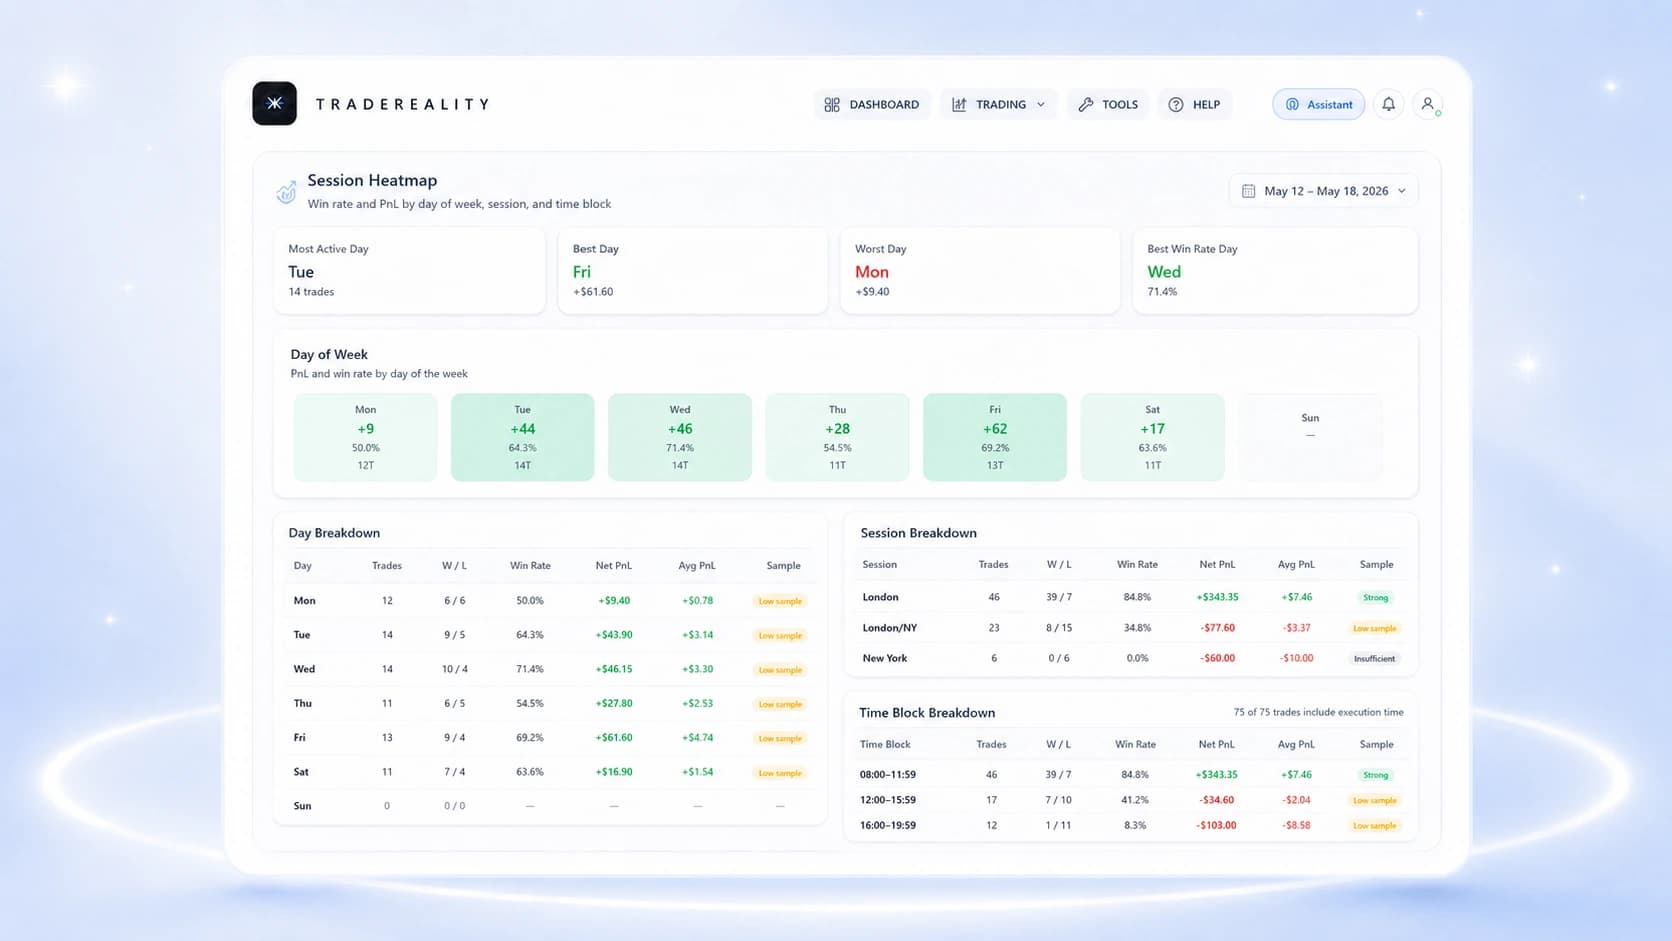
Session time-block patterns

Which hours and days consistently produce better or worse results relative to your session rules.

Calendar and P&L review

The P&L calendar shows day-level results across the month — how many sessions were profitable, how many were flat, and how many ran into consecutive losses. This is the broadest view of performance consistency.

Calendar review surfaces patterns that trade-by-trade review misses: the day of the week that consistently underperforms, the weeks where session discipline breaks down, the months where a behavioral change is clearly visible.

Journal markers on the calendar link directly to session notes, so you can correlate behavioral observations with performance outcomes at a glance.

TradeReality daily P&L calendar with session markers and behavioral indicators

Session time-block analysis

Time-block analysis answers the question: when do you perform better or worse? Not by intuition — by looking at aggregated results across all recorded sessions, segmented by hour and day of the week.

For binary options traders, this matters because market behavior and personal alertness vary across the trading day. A session window that consistently produces worse results may reflect a market condition, a behavioral pattern, or a combination of both. Time-block analytics makes that distinction possible.

The session heatmap in TradeReality shows this breakdown visually — color-coded by result quality so underperforming time blocks are immediately visible.

TradeReality session heatmap showing performance by hour and day of week

Asset, direction, and payout breakdown

Binary edge analysis in TradeReality segments results by asset, direction (call vs put), and payout structure. This makes it visible whether a performance issue is instrument-specific, directional, or structural.

Asset breakdownWin rate and result quality segmented by each traded instrument
Direction splitCall vs. put performance to surface directional bias or inconsistency
Payout-adjusted breakevenBreakeven threshold calculated from your actual payout history
Expiry clusterResults grouped by expiry duration to show whether timing choices affect outcomes

What analytics cannot do

Analytics reviews past behavior. It does not predict market direction, suggest future trades, or guarantee any performance outcome.

TradeReality does not provide trading signals, market commentary, or financial advice. It does not recommend which assets to trade, which direction to take, or which expiry to use. Those decisions remain entirely with the trader.

The value of analytics is clarity about what has already happened — not guidance about what will happen next. Clear evidence about past execution is the foundation for deliberate improvement. It is not a shortcut.

FAQ

What is binary options analytics?

Binary options analytics is the process of reviewing performance data — win rate, asset breakdown, session patterns, payout structure, and behavioral indicators — to identify strengths, weaknesses, and recurring execution patterns.

What metrics matter most in binary options analytics?

Win rate relative to breakeven is the foundational metric. Beyond that, session time-block performance, asset-specific results, direction bias, and trade count per session reveal behavioral and execution patterns.

What is breakeven win rate in binary options?

Breakeven win rate is the minimum percentage of winning trades needed to cover losses given the payout structure. For example, at 80% payout on wins and 100% loss on losses, you need approximately 56% win rate to break even.

Can analytics predict future binary options results?

No. Analytics reveal patterns in past behavior and execution. They do not predict market outcomes or guarantee future performance. TradeReality does not provide predictions or signals of any kind.

How is binary options analytics different from a trade log?

A trade log records individual results. Analytics aggregates those results across assets, sessions, time blocks, and behavioral indicators to surface patterns that are invisible at the individual trade level.

Does TradeReality connect to brokers for analytics data?

No. All data in TradeReality is entered manually. There is no broker connection, automatic import, or external data integration.

Review your binary options performance with evidence.

Calendar, session, asset, and behavioral analytics built from your own trade data — without signals or predictions.

Disclaimer: TradeReality is educational analytics software. It does not provide financial advice, trade signals, or market predictions. Past performance data does not predict future results. Trading binary options involves significant risk of financial loss. All trading decisions remain solely with the user.